ESPHome Auto-Restart Script
Introduction Running various services at home can be a great convenience, but it’s incredibly frustrating when the network goes down and you’re not there to restart everything. I’ve …
There are quite a few options for monitoring your whole house water or power usage, but i’m not thrilled about adding a bunch of extra hardware to my breaker panel.
I’ve known for a while that the city reads my utility meters by driving by, but had assumed this radio technology was some kind of encrypted proprietary data that I couldn’t access. However it turns out most utility meters in the US broadcast their readings in a completely unencrypted format every 15-60 seconds and with the recent advances in Software Defined Radio’s it doesn’t require anything particularly complex to pick it up.
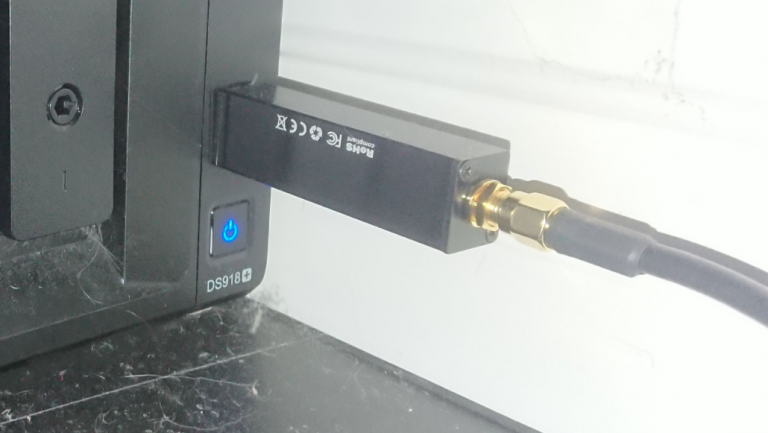
I bought a Nooelec NESDR Smart v4 for $40 and then plugged it straight into the USB port on my Synology NAS. It does get quite hot in regular operation, but that doesn’t seem to affect its performance.
I was then able to make a meters bucket on my InfluxDB database
curl 'http://nas-server:8086/query?pretty=true' --data-urlencode "q=CREATE database meters"
The tools I’ll need to capture the readings are as follows:
Fortunately, I found a handy docker image that rolls all that together into one:
docker \
  run \
  -d \
  --privileged \  # Normally docker container can't access USB
  -v /dev/bus/usb:/dev/bus/usb \  # This maps the whole USB bus to this docker container, probably overkill
  --name rtlamr \ # Here's a name
  -e COLLECT_INFLUXDB_USER=user \ # Add your InfluxDB credentials here
  -e COLLECT_INFLUXDB_PASS=pass \
  -e COLLECT_INFLUXDB_HOSTNAME=http://nas-server:8086 \
  -e COLLECT_INFLUXDB_DATABASE=meters \  # Here's the bucket we're writing to, don't forget to create it first
  -e RTLAMR_FORMAT=json \  # This is very important
  -e RTLAMR_MSGTYPE=scm,r900 \  # These two message types grab my meters, you can use "all" if unsure
  shoginn/rtlamr-collect:latest   # The image to run
Let’s let it run for a while and look at the data in influx:
from(bucket: "meters")
  |> range(start: dashboardTime)
  |> filter(fn: (r) => r._measurement == "rtlamr" and (r._field == "consumption"))
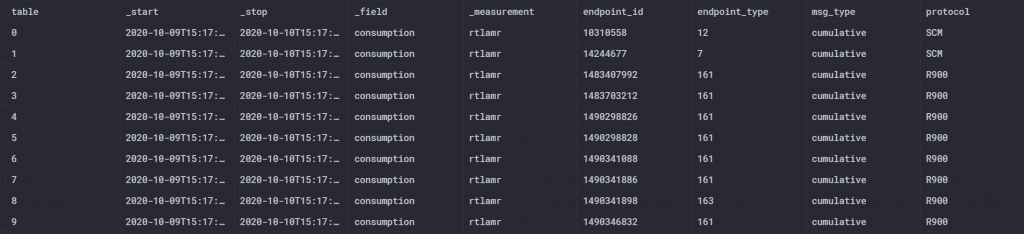
Well that seems to work, all in all I can see pretty reliable transmissions from about 50 utility meters. Figuring out which endpoint_id belongs to my meters required a bit of detective work but I found something that mostly corresponded to my endpoint on both my electricity and water meters.
The next challenge will be to use InfluxDB to get those numbers into a usable format for monitoring.
Introduction Running various services at home can be a great convenience, but it’s incredibly frustrating when the network goes down and you’re not there to restart everything. I’ve …
Introduction This tutorial walks you through the steps to set up a Worldwide Asset eXchange (WAX) test server, establish the WAX currency and transfer some into a test account. This was tested on …
Introduction As part of a larger project, I wanted a way to capture the audio signal from our HiFi and sample it with an ESP32 Microcontroller. Our HiFi has a handy tape-dubbing output which I’m …